


WD-XRF COMPOSITION MAPPING
OF A PZT SPUTTERING TARGET
EFFECTIVE MEASUREMENTS WITH WD-XRF:
- Composition of multi-element sputtering targets
- High precision and throughput,
- Including trace elements analysis.


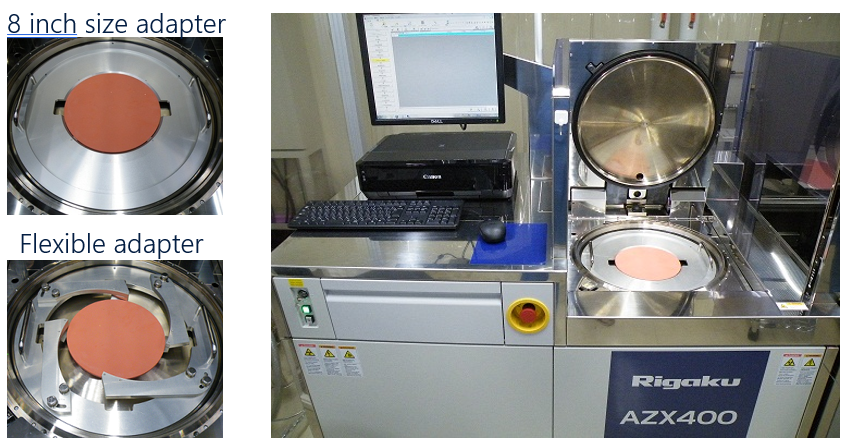
AZX 400 Sequential WDXRF Spectrometer and Sample Adapters
The AZX 400 can analyze sputtering targets non-destructively over a wide range of elements (B to U). Using interchangeable sample adapters, the AZX 400 can also evaluate film thickness and composition of processed wafers.
In this report, the Rigaku AZX 400 (sequential WDXRF spectrometer) maps composition across a PbZrTi(O) sputtering target.
Intense peak(s) will appear for the dominant elements (in this case, Pb, Zr, and Ti). For them, the user should consider the possibility of counting loss (by employing a filter to reduce Pb and Zr, in this case). This sample includes trace Si and Al.
AZX 400 software has a standardless, semi-quantitative analysis program, called “SQX”. With this program, a qualitative scan is run, and the detected elements are then quantified by the
Fundamental Parameter (FP) method without the use of reference standard samples. SQX analysis has been performed including Si and Al.
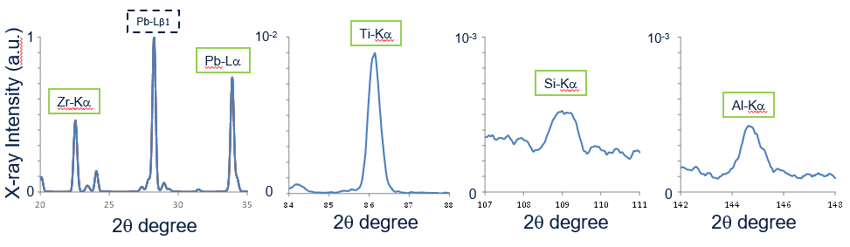
WD-XRF Peak Intensity for Pb, Zr, Ti, Si, and Al Elements of Interest
azx 400 measurement conditions
*Filters, such as Cu or Sn, are normally used to reduce diffraction, but they are also used to reduce background and excessive intensity.
| Element Spectrum | Pb Lα | Ze Lα | Ti Kα | Al Kα | Si Kα |
| kV-mA | 50 kV - 60 mA | 30 kV - 100 mA | |||
| Primary Filter | *F-Cu | *F-Cu | *F-Sn | OUT | OUT |
| Diameter | 20 mm | ||||
| Counting Time (s) Peak | 10 | 10 | 10 | 20 | 20 |
| Background | 5 | 5 | 5 | 10 | 10 |
10-time Repeatability Test (Center Point)
| Component | PbP Comp. | ZrO2 Comp. | TiO2 Comp. | SiO2 Comp. | Al2O3 Comp. |
| Unit | mol% | mol% | mol% | mol% | mol% |
| Data No. | 10 | 10 | 10 | 10 | 10 |
| Average | 54.798 | 2.407 | 21.659 | 0.087 | 0.050 |
| Max. | 54.849 | 23.438 | 21.722 | 0.089 | 0.053 |
| Min. | 54.758 | 23.373 | 21.575 | 0.082 | 0.048 |
| Range | 0.091 | 0.065 | 0.147 | 0.007 | 0.005 |
| Std. Dev. | 0.025 | 0.023 | 0.041 | 0.002 | 0.002 |
| R.S.D. (%) | 0.05 | 0.10 | 0.19 | 2.65 | 3.05 |
MAPPING POINTS AND 25-POINT MAPPING RESULTS
| Component | PbP Comp. | ZrO2 Comp. | TiO2 Comp. | SiO2 Comp. | Al2O3 Comp. |
| Unit | mol% | mol% | mol% | mol% | mol% |
| Data No. | 25 | 25 | 25 | 25 | 25 |
| Average | 54.782 | 23.427 | 21.654 | 0.085 | 0.053 |
| Max. | 54.888 | 23.480 | 21.860 | 0.112 | 0.099 |
| Min. | 54.620 | 23.353 | 21.501 | 0.065 | 0.040 |
| Range | 0.268 | 0.127 | 0.359 | 0.047 | 0.059 |
| Std. Dev. | 0.064 | 0.034 | 0.090 | 0.013 | 0.011 |
| R.S.D. (%) | 0.12 | 0.14 | 0.41 | 15.49 | 19.96 |
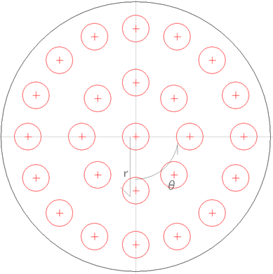
Mapping Points and 25-point Mapping Results
Maps Depicting the Spatial Distribution
of the Trace Elements
The AZX 400 sequential WDXRF spectrometer offers analytical flexibility to to measure large and/or heavy samples, like sputtering targets, as well as wafers and coupons of various size. Mapping capability can show the spatial distribution of elements, including trace elements.
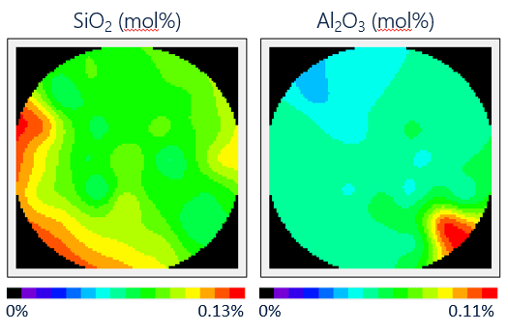
Maps Depicting the Spatial Distribution of the Trace Elements